Bus it to the Buckeyes
Industry | Service
Methods | Observation, Intercepts Interviews
Timeline | 8-weeks
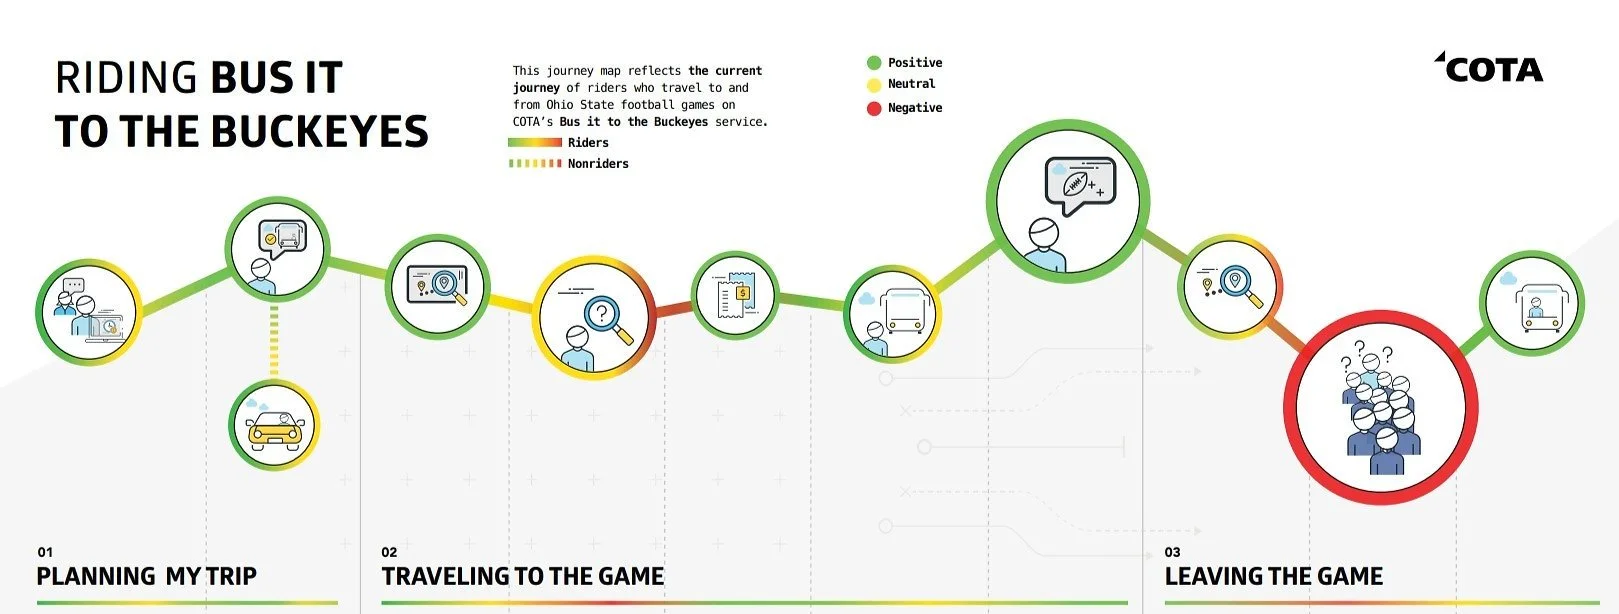
Bus it to the Buckeyes (BITTB) is a unique service offered by The Central Ohio Transit Authority (COTA) to provide easy, convenient, hassle-free transportation to and from the Ohio State football games.
COTA believed the service was underutilized and could be improved with greater awareness, ease of access, and improvements to the rider journey from beginning to end.
Snapshot


Overview
Objectives
Identify both short-term and long-term opportunities for COTA to improve the value and service experience in areas such as:
Marketing efforts to raise awareness for varying user segments.
Increase confidence and engagement satisfaction with service touchpoints and interactions for current riders.
Identify opportunities for improved information, workflow, artifacts, communication, etc. for COTA employees.
My Role
As the User Research Lead, I ran the study E2E and also:
Produced recommendations for the COTA team to improve various touch-points of the BITTB experience for current riders.
Created additional deliverables that focused on opportunities for converting non-riders.
Proposed opportunities to improve communication & workflow for COTA employees on game days.
Hosted an Opportunity Workshop for the COTA team.
Brainstormed short-term and long-term opportunities for improvement with COTA team, based on my recommendations.
Outcomes
Created discussion guides, materials, and instructions to hand out to my research team (2-3 colleagues who volunteered to assist with intercepts on game days).
Conducted interviews with COTA staff to understand the BITTB process, employee touch-points, and better inform which questions were required of riders/non-riders.
Interviewed riders, collected qualitative and quantitative data to assess satisfaction and performance of the BITTB experience.
Interviewed non-riders to understand knowledge (if any) of the BITTB service. Probed into current experience traveling to game day and potential usage of the BITTB service.
Analyzed qualitative data for all segments (employee, rider, non-rider) and identified themes.
Data Collection
Example of the qualitative data that was collected.
Non-rider data is showcased.

Refined Themes
Example of the analysis after patterns have been identified from the raw data. Detailed analysis is collapsed to showcase refined statements that tie into larger patterns.

Conversion
Example of a draft that helped to tell the story of the non-rider experience and potential opportunities for improvement. This data was then refined and converted into a separate deliverable for the COTA team.

Nitty-Gritty
Methods
1:1 interviews with COTA staff
15 min. intercepts with riders/non-riders
Expert evaluation on the BITTB service
Participants
60 game attendees — 30 rider, 30 non-riders
15 employees — 4 Site managers, 6 ticketing staff, 5 bus riders
Analysis
Thematic analysis on qual data, transcribed from physical notes to excel
Deliverable
Journey map
Detailed findings and insights broken down by step in the journey
Recommendations for how to improve experience for employees, riders, and non-riders
Impact
In the off-season, COTA revamped their service by rearranging their teams to reflect the steps in the journey, ensuring staff had ownership and resources for their respective journey step
Each staff member in charge of a journey step was tasked with implementing the recommendations
Follow-up
The success of this work resulted in another service design project for the “Red, White, and Boom!” 4th of July rider experience